Chapter 5A

(AST305) Lifetime Data Analysis I

Author

Md Rasel Biswas

5 Inference Procedures for Log-location-scale Distributions

Review: Location–scale and Log-location–scale distributions

Location–scale distributions

  • A random variable \(Y\) is said to follow a location–scale distribution with location parameter \(u \in \mathbb{R}\) and scale parameter \(b>0\) if its survivor function can be written as \[ S_Y(y; u, b) = P(Y > y) = S_0\!\left(\frac{y - u}{b}\right), \qquad -\infty < y < \infty, \] where \(S_0(\cdot)\) is a fixed standard survivor function.

  • The corresponding probability density function is \[ f_Y(y; u, b) = \frac{1}{b}\, f_0\!\left(\frac{y - u}{b}\right), \] where \[ f_0(z) = -\frac{d}{dz} S_0(z). \]


Standardization

  • Define the standardized variable \[ Z = \frac{Y - u}{b}. \]

  • Then \(Z\) has survivor function \(S_0(z)\) and density \(f_0(z)\).

  • Thus, all members of the location–scale family are obtained by shifting and rescaling a single standard distribution.


Examples

  • Common examples of location–scale distributions for \(Y\) include

    • normal,
    • logistic,
    • extreme-value (Gumbel).
  • These distributions are particularly important because they lead to flexible parametric models for lifetime data after log transformation.


Log-location–scale distributions

  • Let \(T>0\) denote a lifetime random variable and define \[ Y = \log T. \]

  • If \(Y\) follows a location–scale distribution with parameters \((u,b)\), then \(T\) is said to follow a log-location–scale distribution.


Survivor function of \(T\)

  • For \(t>0\), \[ \begin{aligned} S_T(t; u, b) &= P(T > t) \\ &= P(\log T > \log t) \\ &= S_0\!\left(\frac{\log t - u}{b}\right). \end{aligned} \] It is often convenient to re-parameterize the model by defining \[ \alpha = e^u, \qquad \beta = {1}/{b}, \] so that \[ \frac{\log t - u}{b} = \beta \log\!\left(\frac{t}{\alpha}\right). \]

  • Define \[ S_0^\star(w) = S_0(\log w), \qquad w>0. \]

  • Then the survivor function of \(T\) can be written as \[ S_T(t; \alpha, \beta) = S_0^\star\!\left[(t/\alpha)^\beta\right]. \]


Interpretation of parameters

  • \(\alpha>0\) is a scale parameter on the original time scale.
  • \(\beta>0\) is a shape parameter controlling the hazard behavior.
  • \(u = \log \alpha\) and \(b = 1/\beta\) are often more convenient for likelihood-based inference.

Common log-location–scale models

Distribution of \(Y=\log T\) Distribution of \(T\)
Extreme-value Weibull
Logistic Log-logistic
Normal Log-normal

5.1 Inference for location-scale distributions

Likelihood based methods

The goal is to estimate the parameters \((u,b)\) or \((\alpha,\beta)\)

For likelihood-based inference, estimating \((u,b)\) (or equivalently \((u,\log b)\)) has several advantages:

  • the log-likelihood is typically closer to quadratic;
  • normal approximations for \((\hat u,\hat b)\) tend to be more accurate;
  • numerical optimization is more stable;
  • most statistical software (e.g., survreg() in R) uses the \((u,\log b)\) parameterization.

In the following sections, likelihood-based inference procedures are developed using the \((u,b)\) parameterization, with results later transformed to \((\alpha,\beta)\) for interpretation on the original time scale.

Likelihood function

  • Suppose we observe a possibly right-censored sample \[ \{(t_i,\delta_i),\; i=1,\ldots,n\}, \] where \(t_i\) is the observed time and \(\delta_i=1\) indicates a failure while \(\delta_i=0\) indicates right censoring.

  • Define \[ y_i=\log t_i \quad\text{and}\quad z_i=\frac{y_i-u}{b}. \]


  • For a log-location–scale model with standard survivor function \(S_0(\cdot)\) and density \(f_0(\cdot)\), the likelihood function is \[ L(u,b) =\prod_{i=1}^n \Bigg[\frac{1}{b}f_0(z_i)\Bigg]^{\delta_i} \Big[S_0(z_i)\Big]^{1-\delta_i}. \]

  • The corresponding log-likelihood function is \[ \ell(u,b) = -r\log b + \sum_{i=1}^n \Big[\delta_i\log f_0(z_i) + (1-\delta_i)\log S_0(z_i)\Big], \] where \(r=\sum_{i=1}^n\delta_i\) is the total number of failures.

Score functions

\[ \begin{aligned} {\color{purple} \ell(u, b)} & = {\color{purple} -r\log b +\sum_{i=1}^n\Big[\delta_i\log f_0(z_i) + (1-\delta_i)\log S_0(z_i)\Big] } \\ & = -r\log b + \sum_{i=1}^n\ell_i(z_i, \delta_i) \end{aligned} \]

\[ \begin{aligned} \frac{\partial \ell(u, b)}{\partial u} &= \sum_{i=1}^n\frac{\partial \ell_i(z_i, \delta_i)}{\partial z_i}\times \frac{\partial z_i}{\partial u}\notag \\ &= \sum_{i=1}^n\frac{\partial \ell_i(z_i, \delta_i)}{\partial z_i}\times \bigg(\frac{-1}{b}\bigg)\notag\\[.5em] & = -\frac{1}{b} \sum_{i=1}^n\bigg[\delta_i\,\frac{\partial \log f_0(z_i)}{\partial z_i} + (1-\delta_i)\, \frac{\partial \log S_0(z_i)}{\partial z_i}\bigg]\notag \end{aligned} \]


\[ {\color{purple} \ell(u, b) = -r\log b +\sum_{i=1}^n\Big[\delta_i\log f_0(z_i) + (1-\delta_i)\log S_0(z_i) \Big]} \]

\[ \begin{aligned} \frac{\partial \ell(u, b)}{\partial b} &= -\frac{r}{b} + \sum_{i=1}^n\frac{\partial \ell_i(z_i, \delta_i)}{\partial z_i}\times \frac{\partial z_i}{\partial b}\notag \\ &= -\frac{r}{b} + \sum_{i=1}^n \frac{\partial \ell_i(z_i, \delta_i)}{\partial z_i}\times \Bigg(\frac{-z_i}{b}\Bigg)\notag\\[.5em] & = -\frac{r}{b} -\frac{1}{b} \sum_{i=1}^nz_i\bigg[\delta_i\,\frac{\partial \log f_0(z_i)}{\partial z_i} + (1-\delta_i)\, \frac{\partial \log S_0(z_i)}{\partial z_i}\bigg]\notag \end{aligned} \]

Hessian matrix

\[ {\color{purple} \frac{\partial \ell(u, b)}{\partial u} = -\frac{1}{b} \sum_{i=1}^n\bigg[\delta_i\,\frac{\partial \log f_0(z_i)}{\partial z_i} + (1-\delta_i)\, \frac{\partial \log S_0(z_i)}{\partial z_i}\bigg]} \]

\[\begin{align*} \frac{\partial^2 \ell(u, b)}{\partial u^2} & = \frac{\partial}{\partial u} \bigg[\frac{\partial \ell(u, b)}{\partial u}\bigg]\\[.35em] %& = \frac{\partial}{\partial %z_i}\bigg[\frac{\partial \ell(u, b)}{\partial u}\bigg]\; %\frac{\partial z_i}{\partial u}\notag \\[.35em] & = \frac{1}{b^2} \sum_{i=1}^n\bigg[\delta_i\,\frac{\partial^2 \log f_0(z_i)}{\partial z_i^2} + (1-\delta_i)\, \frac{\partial^2 \log S_0(z_i)}{\partial z_i^2}\bigg] \end{align*}\]


\[ {\color{purple}\frac{\partial \ell(u, b)}{\partial b} = -\frac{r}{b} -\frac{1}{b} \sum_{i=1}^nz_i\bigg[\delta_i\,\frac{\partial \log f_0(z_i)}{\partial z_i} + (1-\delta_i)\, \frac{\partial \log S_0(z_i)}{\partial z_i}\bigg]} \]

\[\begin{align*} \frac{\partial^2 \ell(u, b)}{\partial b^2} & = \frac{r}{b^2} +\frac{2}{b^2} \sum_{i=1}^nz_i\bigg[\delta_i\,\frac{\partial \log f_0(z_i)}{\partial z_i} + (1-\delta_i)\, \frac{\partial \log S_0(z_i)}{\partial z_i}\bigg]\\[.25em] & \;\;\;+\frac{1}{b^2}\sum_{i=1}^nz_i^2\bigg[\delta_i\,\frac{\partial^2 \log f_0(z_i)}{\partial z_i^2} + (1-\delta_i)\, \frac{\partial^2 \log S_0(z_i)}{\partial z_i^2}\bigg] \end{align*}\]


\[\begin{align*} {\color{purple} \frac{\partial \ell(u, b)}{\partial u}} &= {\color{purple}-\frac{1}{b} \sum_{i=1}^n\bigg[\delta_i\,\frac{\partial \log f_0(z_i)}{\partial z_i} + (1-\delta_i)\, \frac{\partial \log S_0(z_i)}{\partial z_i}\bigg]} \\[.5em] \frac{\partial^2 \ell(u, b)}{\partial u\,\partial b} & = \frac{1}{b^2} \sum_{i=1}^n\bigg[\delta_i\,\frac{\partial \log f_0(z_i)}{\partial z_i} + (1-\delta_i)\, \frac{\partial \log S_0(z_i)}{\partial z_i}\bigg]\\[.25em] &\;\; \;\;+ \frac{1}{b^2} \sum_{i=1}^nz_i\bigg[\delta_i\,\frac{\partial^2 \log f_0(z_i)}{\partial z_i^2} + (1-\delta_i)\, \frac{\partial^2 \log S_0(z_i)}{\partial z_i^2}\bigg] \end{align*}\]

Score function and information matrix

\[ \begin{aligned} U(u, b) &= \begin{bmatrix} \frac{\partial \ell(u, b)}{\partial u} \\[.5em] \frac{\partial \ell(u, b)}{\partial b} \end{bmatrix} \\[1em] I(u, b) & = -H(u, b) = -\begin{bmatrix} \frac{\partial^2 \ell(u, b)}{\partial u^2} & \frac{\partial^2 \ell(u, b)}{\partial u\,\partial b} \\[.25em] \frac{\partial^2 \ell(u, b)}{\partial b\,\partial u} & \frac{\partial^2 \ell(u, b)}{\partial b^2} \end{bmatrix} \end{aligned} \]

Statistical inference

  • The maximum likelihood estimator (MLE) of \((u,b)\) is defined as \[ (\hat u, \hat b)' = {\arg\,\max}_{(u, b)' \in \Theta} \ell(u, b). \]

  • Under regularity conditions, the asymptotic covariance matrix of \((\hat u,\hat b)'\) can be estimated by the inverse of the observed information matrix evaluated at the MLEs: \[ \operatorname{Var}\!\begin{pmatrix}\hat u \\ \hat b\end{pmatrix} \approx \hat V = \Big[I(\hat u, \hat b)\Big]^{-1}, \]

  • Sampling distribution

\[ \begin{pmatrix}\hat u \\ \hat b\end{pmatrix} \sim \mathcal{N}_2\begin{pmatrix} \begin{bmatrix} u \\ b\end{bmatrix}, \Big[I(\hat u, \hat b)\Big]^{-1} \end{pmatrix} \]

Wald type CIs

  • For a large \(n\), \((\hat u, \hat b)'\) follows a bivariate normal distribution with mean \((u, b)'\) and variance matrix \(\hat V\)

  • Standard error of \(\hat u\) and \(\hat b\) can be obtained from the diagonal elements of \(\hat V\) \[ se(\hat u) = \hat{V}_{11}^{1/2}\;\;\text{and}\;\;se(\hat b) = \hat{V}_{22}^{1/2} \]


  • Following pivotal quantities follow standard normal distributions \[ \begin{aligned} Z_1 = \frac{\hat u - u}{se(\hat u)},\;\; \;\;\; Z_2 = \frac{\hat b - b}{se(\hat b)}, \;\;\;\;\; Z_2' = \frac{\log \hat b - \log b}{se(\log \hat b)} \end{aligned} \]

    • \(se(\log \hat b) = se(\hat b)/\hat b\)
  • \((1-p)100\%\) confidence intervals \[ \begin{aligned} \hat u &\pm z_{1-p/2}\,se(\hat u) \\ \hat b &\pm z_{1-p/2}\,se(\hat b) \\ \hat b &\exp\{\pm z_{1-p/2}\,se(\log \hat b)\} \end{aligned} \]

Likelihood ratio test based CI

  • Normal approximation based confidence intervals could be inaccurate for small samples

  • An alternative to normal approximation, bootstrap simulations can be used to estimate the distributions of pivots

  • All these methods can perform poorly in small samples with heavy censoring

  • Implementation of likelihood ratio based confidence intervals is relatively complicated, but LRT based CI often performs better in small and medium-size samples

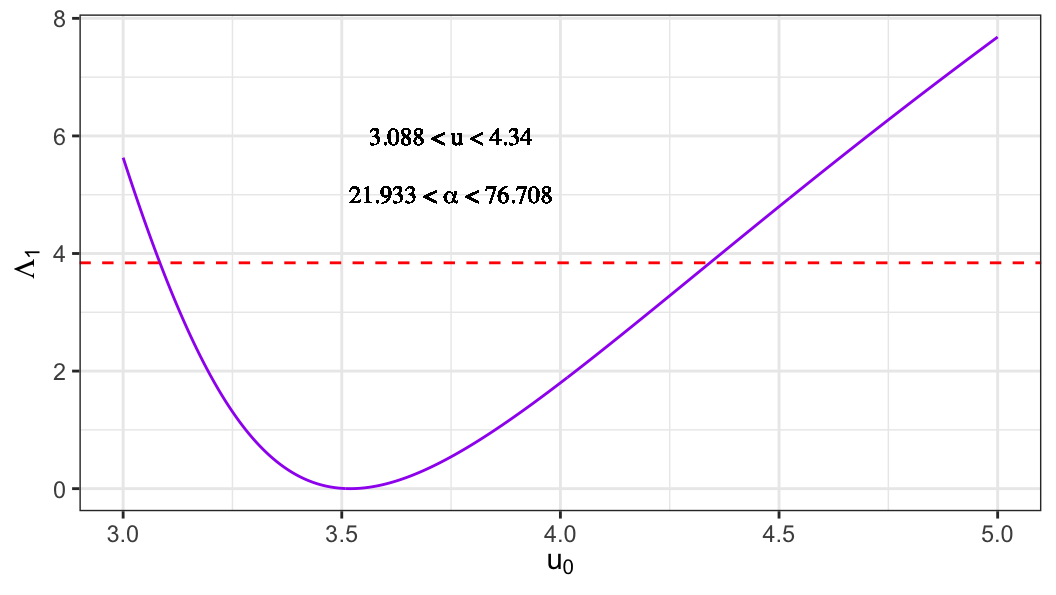
LRT-based CI for the location parameter \(u\)

To test the null hypothesis \(H_0: u = u_0\), the likelihood ratio test statistic is \[ \Lambda_1(u_0) = 2\ell(\hat u, \hat b) - 2\ell(u_0, \tilde b(u_0)), \] where \[ \begin{aligned} (\hat u, \hat b)' &= {\arg\,\max}_{(u, b)' \in \Theta} \ell(u, b), \qquad \text{(unrestricted MLEs)}, \\ \tilde b(u_0) &= {\arg\,\max}_{b \in \Theta} \ell(u_0, b), \qquad \text{(MLE under } H_0\text{)}. \end{aligned} \]


  • Under \(H_0\), \[ \Lambda_1(u_0) \xrightarrow{d} \chi^2_{(1)}. \]

  • An approximate two-sided \(100(1-p)\%\) confidence interval for \(u\) is given by the set of values \(u_0\) such that \[ \Lambda_1(u_0) \leq \chi^2_{(1),\,1-p}. \]


Homework
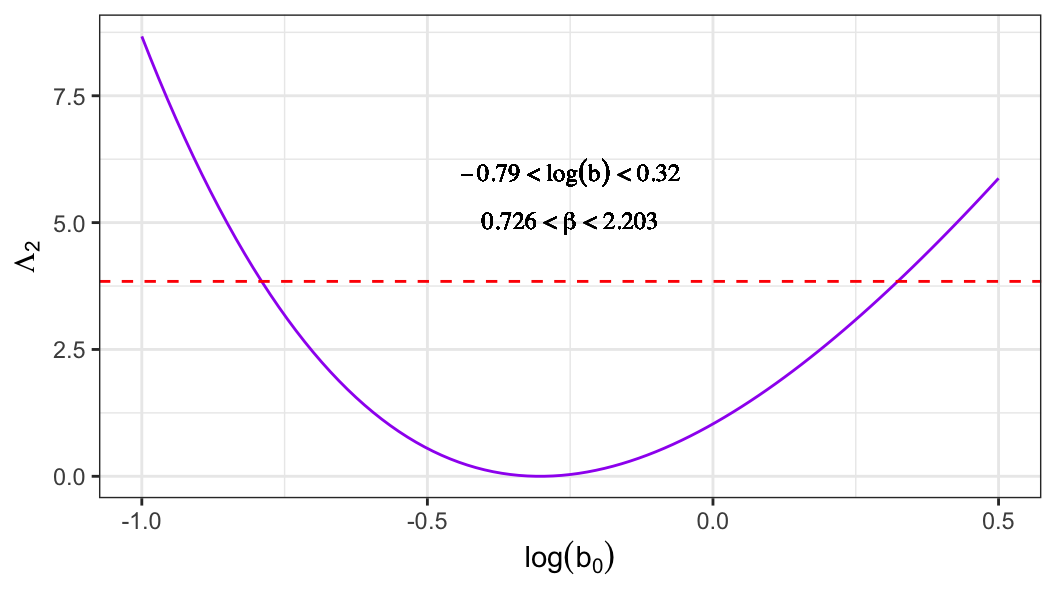
  • Derive the likelihood ratio test–based confidence interval for the scale parameter \(b\).

Quantiles and their confidence intervals

Quantiles of log-lifetime

  • The \(p\)th quantile of the log-lifetime variable \(Y\) satisfies \[ P(Y \le y_p) = p. \]

  • Equivalently, \[ S_0\!\left(\frac{y_p-u}{b}\right)=1-p, \] which implies \[ y_p = u + b w_p, \qquad w_p = S_0^{-1}(1-p)=F_0^{-1}(p). \]


Wald-type CI for \(y_p\)

An estimator of \(y_p\) is \[ \hat y_p = \hat u + \hat b w_p. \]

Using the delta method, its standard error is \[ se(\hat y_p) = \sqrt{\hat V_{11} + w_p^2 \hat V_{22} + 2w_p \hat V_{12}}. \]

The pivotal quantity \[ Z_p = \frac{\hat y_p - y_p}{se(\hat y_p)} \] is approximately standard normal, leading to a \(100(1-q)\%\) confidence interval \[ \hat y_p \pm z_{1-q/2}\,se(\hat y_p). \]


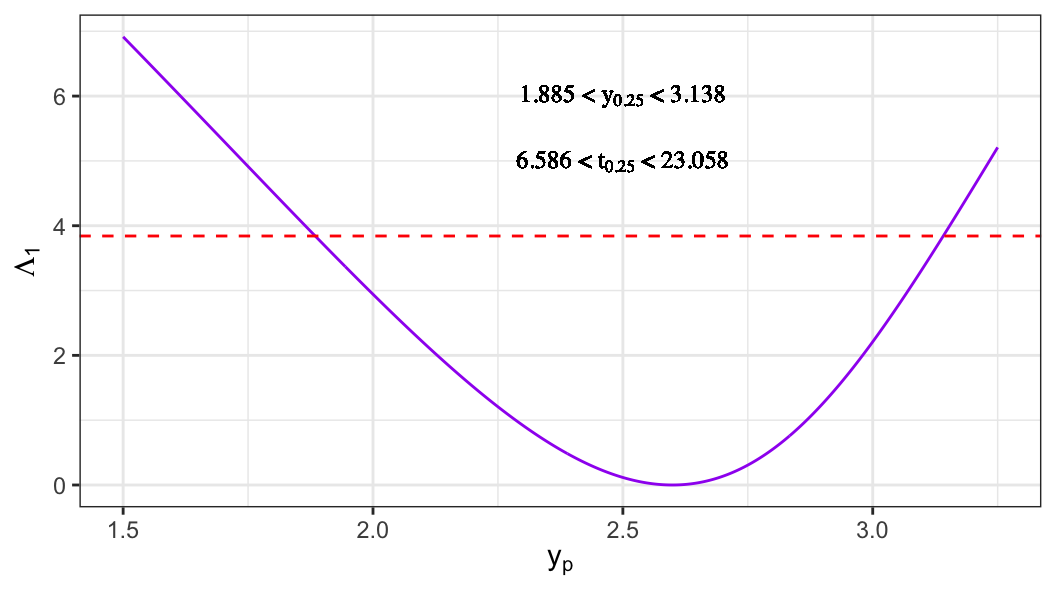
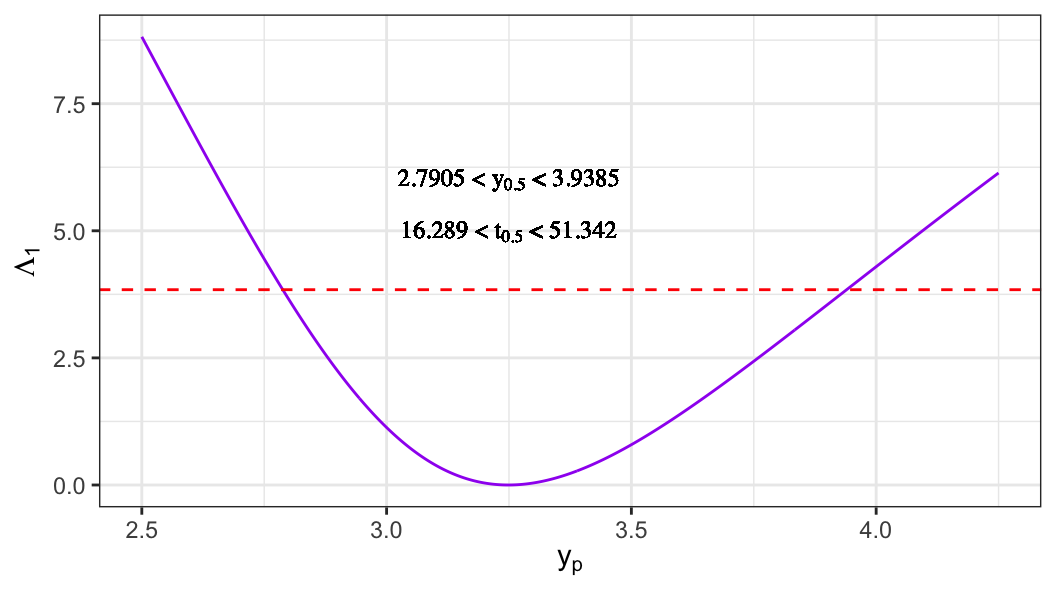
LRT-based CI for quantiles

The \(p\)th quantile can be expressed as \[ y_p = u + w_p b. \]

To obtain an LRT-based confidence interval for \(y_p\), consider the null hypothesis \[ H_0: y_p = y_{p_0}. \]

The likelihood ratio statistic is \[ \Lambda(y_{p_0}) = 2\ell(\hat u, \hat b) - 2\ell(\tilde u, \tilde b), \tag{5.1}\] where \((\tilde u,\tilde b)\) are the MLEs under \(H_0\).


Steps to compute \((\tilde u,\tilde b)\)

  1. Under \(H_0\), \(u = y_{p_0} - w_p b\).
  2. Obtain \[ \tilde b = {\arg\,\max}_{b\in\Theta} \ell(y_{p_0}-w_pb,\,b). \]
  3. Set \[ \tilde u = y_{p_0} - w_p \tilde b. \]

An approximate \(100(1-q)\%\) confidence interval for \(y_p\) is given by the set of \(y_{p_0}\) values satisfying \[ \Lambda(y_{p_0}) \le \chi^2_{(1),\,1-q}. \]


  • The general likelihood results developed above apply to all log-location–scale models.

  • In the following sections, these results are specialized to particular distributions, beginning with the extreme-value and Weibull models.

5.2 Weibull and extreme-value distributions

  • The pdf of Weibull distribution \[\begin{align} f(t; \alpha, \beta) = \frac{\beta}{\alpha}\;\bigg(\frac{t}{\alpha}\bigg)^{\beta-1} \exp\Big[-\big(t/\alpha\big)^\beta\Big] \end{align}\]

    • \(\alpha>0\) and \(\beta>0\) are scale and shape parameters, respectively

  • The pdf of extreme-value distribution \[\begin{align} f(y; u, b) &= \frac{1}{b}\;\exp\big[(y-u)/b\big]\;\exp\Big[-e^{(y-u)/b}\Big] \\ & = \frac{1}{b}\,f_0\Big(\frac{y-u}{b}\Big) \end{align}\]

    • \(u=\log\alpha\)

    • \(b=(1/\beta)\)

  • Extreme-value distribution is used to make inferences about Weibull distribution

Likelihood based inference procedures

  • Censored sample \[ \big\{(t_i, \delta_i),\;i=1, \ldots, n\big\} \]

  • Define \[y_i =\log t_i \;\;\text{and}\;\; z_i = (y_i - u)/b\]


  • General expression of likelihood function \[ {\color{purple} \ell(u, b) = -r\log b +\sum_{i=1}^n\Big[\delta_i\log f_0(z_i) + (1-\delta_i)\log S_0(z_i) \Big]} \]

  • For extreme-value distribution \[\begin{align*} S_0(z) &= \exp(-e^z)\\[.25em] f_0(z) &= -\frac{d}{dz}S_0(z)=\exp(z-e^z) \end{align*}\]


\[ {\color{purple} \ell(u, b) = -r\log b +\sum_{i=1}^n\Big[\delta_i\log f_0(z_i) + (1-\delta_i)\log S_0(z_i) \Big]} \]

  • Log-likelihood function for EV distribution \[ {\color{red}\ell(u, b) = -r\log b +\sum_{i=1}^n\big(\delta_iz_i - e^{z_i}\big) } \tag{5.2}\]
    • \(r=\sum_i\delta_i\)
  • This log-likelihood function \(\ell(u,b)\) is easily maximized to give \({\hat u}, {\hat b}\) (using software)

Score functions

  • The general expression for location-scale family can also help us find the expressions for the first (and also second) derivatives of \(\ell(u, b)\).

  • General expressions \[\begin{align} \frac{\partial \ell(u, b)}{\partial u} & = -\frac{1}{b} \sum_{i=1}^n\bigg[\delta_i\,\frac{\partial \log f_0(z_i)}{\partial z_i} + (1-\delta_i)\, \frac{\partial \log S_0(z_i)}{\partial z_i}\bigg]\notag \\[.25em] \frac{\partial \ell(u, b)}{\partial b} & = -\frac{r}{b} -\frac{1}{b} \sum_{i=1}^nz_i\bigg[\delta_i\,\frac{\partial \log f_0(z_i)}{\partial z_i} + (1-\delta_i)\, \frac{\partial \log S_0(z_i)}{\partial z_i}\bigg]\notag \end{align}\]


  • For extreme-value distribution \[\begin{align*} \frac{\partial \log f_0(z)}{\partial z} & = \frac{\partial}{\partial z} \log\big\{\exp(z-e^z)\big\} =1 - e^z \\[.25em] \frac{\partial \log S_0(z)}{\partial z} & = \frac{\partial}{\partial z} \log\big\{\exp(-e^z)\big\} =- e^z \end{align*}\]

  • These gives straightforward expressions for the first and second derivatives of \(\ell(u, b)\), which can be used to find MLEs, \({\hat u}, {\hat b}\)

Hessian matrix

  • Hessian matrix at MLEs \(\hat u\) and \(\hat b\) \[ H(\hat u, \hat b) = -\frac{1}{\hat b^2}\begin{bmatrix} r & \sum_{i=1}^n \hat z_i e^{\hat z_i}\\[.5em] \sum_{i=1}^n \hat z_i e^{\hat z_i} & r + \sum_{i=1}^n \hat z_i^2 e^{\hat z_i} \end{bmatrix} \]
  • For extreme-value distribution

\[\begin{align*} \frac{\partial^2 \ell(u, b)}{\partial u^2} & = \frac{1}{b^2} \sum_{i=1}^n\bigg[\delta_i\,\frac{\partial^2 \log f_0(z_i)}{\partial z_i^2} + (1-\delta_i)\, \frac{\partial^2 \log S_0(z_i)}{\partial z_i^2}\bigg] =-\frac{1}{b^2} \sum_{i=1}^n e^{z_i} \end{align*}\] where \[\begin{align*} \frac{\partial^2 \log f_0(z)}{\partial z^2} & = \frac{\partial}{\partial z} \big\{1 - e^z\big\} = -e^z= \frac{\partial^2 \log S_0(z)}{\partial z^2} \end{align*}\]

\[\begin{align} {\color{purple} \frac{\partial^2 \ell(u, b)}{\partial b^2} \bigg\vert_{u=\hat u, \,b=\hat b}=-\frac{1}{\hat b^2} \sum_{i=1}^n e^{\hat z_i}=-\frac{r}{\hat b^2}} \end{align}\]

From Section 5.1.4, it can be shown that the Hessian matrix will be

\[\begin{align*} \frac{\partial^2 \ell(u, b)}{\partial b^2} & = \frac{r}{b^2} +\frac{2}{b^2} \sum_{i=1}^nz_i\bigg[\delta_i\,\frac{\partial \log f_0(z_i)}{\partial z_i} + (1-\delta_i)\, \frac{\partial \log S_0(z_i)}{\partial z_i}\bigg]\\[.25em] & \;\;\;+\frac{1}{b^2}\sum_{i=1}^nz_i^2\bigg[\delta_i\,\frac{\partial^2 \log f_0(z_i)}{\partial z_i^2} + (1-\delta_i)\, \frac{\partial^2 \log S_0(z_i)}{\partial z_i^2}\bigg]\\[.25em] & = \frac{r}{b^2} +\frac{2}{b^2} \sum_{i=1}^nz_i \big[\delta_i(1-e^{z_i}) -(1-\delta_i)e^{z_i}\big] -\frac{1}{b^2}\sum_{i=1}^nz_i^2 e^{z_i} \\[.25em] &=\frac{r}{b^2} +\frac{2}{b^2} \sum_{i=1}^nz_i\big[\delta_i-e^{z_i}\big] -\frac{1}{b^2}\sum_{i=1}^nz_i^2 e^{z_i} \end{align*}\]

\[\begin{align} {\color{purple} \frac{\partial^2 \ell(u, b)}{\partial b^2} \bigg\vert_{u=\hat u,\,b=\hat b}= -\frac{r}{\hat b^2}-\frac{1}{\hat b^2}\sum_{i=1}^n\hat z_i^2 e^{\hat z_i}} \end{align}\]

\[\begin{align*} \frac{\partial^2 \ell(u, b)}{\partial u\,\partial b} & = \frac{1}{b^2} \sum_{i=1}^n\bigg[\delta_i\,\frac{\partial \log f_0(z_i)}{\partial z_i} + (1-\delta_i)\, \frac{\partial \log S_0(z_i)}{\partial z_i}\bigg]\\[.25em] &\;\; \;\;+ \frac{1}{b^2} \sum_{i=1}^nz_i\bigg[\delta_i\,\frac{\partial^2 \log f_0(z_i)}{\partial z_i^2} + (1-\delta_i)\, \frac{\partial^2 \log S_0(z_i)}{\partial z_i^2}\bigg] \\[.25em] & = \frac{1}{b^2} \sum_{i=1}^n\Big[\delta_i(1-e^{z_i}) - (1-\delta_i)e^{z_i}-z_ie^{z_i}\Big]\\[.25em] & = \frac{1}{b^2} \sum_{i=1}^n\Big[\delta_i - e^{z_i}-z_ie^{z_i}\Big] = \frac{1}{b^2} \Big[r -\sum_{i=1}^n e^{z_i}-\sum_{i=1}^n z_ie^{z_i} \Big] \end{align*}\]

\[\begin{align} {\color{purple} \frac{\partial^2 \ell(u, b)}{\partial u\,\partial b} \bigg\vert_{u=\hat u,\,b=\hat b}= -\frac{1}{\hat b^2}\sum_{i=1}^n\hat z_i e^{\hat z_i}} \end{align}\]

Covariance matrix

  • Observed information matrix at MLEs \(\hat u\) and \(\hat b\) \[\begin{align*} I(\hat u, \hat b) &= -H(\hat u, \hat b) \\[.25em] & = \frac{1}{{\hat{b}}^2}\begin{bmatrix} r & \sum_{i=1}^n \hat z_i e^{\hat z_i}\\[.5em] \sum_{i=1}^n \hat z_i e^{\hat z_i} & r + \sum_{i=1}^n \hat z_i^2 e^{\hat z_i} \end{bmatrix} \end{align*}\]

  • Covariance matrix of \((\hat u, \hat b)'\) \[\begin{align} \hat V & = \Big[I(\hat u, \hat b)\Big]^{-1} \end{align}\]


  • MLEs of \(\alpha\) and \(\beta\) (Weibull model parameters) \[ \hat\alpha = e^{\hat u}\;\;\text{and}\;\;\hat\beta=1/\hat b \]

  • Covariance matrix of \((\hat\alpha, \hat\beta)'\) (using multivariate delta method) \[ {\color{purple} \operatorname{var}(\hat\alpha, \hat\beta) = \boldsymbol{G}\,\hat V\,\boldsymbol{G}'} \] where \[ G = \begin{bmatrix} \frac{\partial g_1(u, b)}{du} & \frac{\partial g_1(u, b)}{\partial b} \\[.25em] \frac{\partial g_2(u, b)}{\partial u} & \frac{\partial g_2(u, b)}{\partial b} \end{bmatrix} = \begin{bmatrix}e^{\hat u} & 0 \\[.25em] 0 & -\frac{1}{\hat b^2} \end{bmatrix} \]

    • \(\alpha = g_1(u, b) = e^u\)

    • \(\beta = g_2(u, b)=(1/b)\)


  • Wald-type statistics based \(100(1-p)\%\) CI for \(u\) and \(b\) \[\begin{align*} \hat u &\pm z_{1-p/2}\;se(\hat u) \\[.25em] \hat b &\pm z_{1-p/2}\;se(\hat b) \\[.25em] \hat b &\exp\Big[\pm z_{1-p/2}\;se(\log \hat b) \Big] \end{align*}\]

CI for \((u, b)\) (LRT based)

  • Log-likelihood function corresponding to \(H_0: b = b_0\) is (from Equation 5.2) \[ \ell(u, b_0) = -r\log b_0 +\sum_{i=1}^n \bigg[\delta_i\, \bigg(\frac{y_i-u}{b_0}\bigg) - e^{(y_i-u)/b_0}\bigg] \]
  • MLE of \(u\) under \(H_0: b=b_0\) \[\begin{align*} \frac{\partial \ell(u, b_0)}{\partial u}\Bigg\vert_{u=\tilde u} =0\;\;\Rightarrow\;\;&-\frac{1}{b_0}\Big[r - \sum_{i=1}^n e^{(y_i - \tilde u)/b_0}\Big] = 0 \\ \;\;\Rightarrow\;\;& {\color{purple} \tilde u(b_0) = b_0\log\bigg[\frac{1}{r}\sum_{i=1}^ne^{y_i/b_0}\bigg]} \end{align*}\]

  • LRT statistics \[ \Lambda(b_0) = 2\ell(\hat u, \hat b) -2\ell(\tilde u(b_0), b_0) \]

  • \(100(1-p)\%\) CI for \(b\) is defined by the set of \(b_0\) values such that \[ \Lambda_1(b_0)\leq \chi^2_{(1), 1-p} \]

  • Similarly, confidence interval for \(u\) can be obtained using the corresponding LRT statistics (Homework)

CI for quantiles

  • The \(p\)th quantile of \(Y\sim EV(u, b)\) \[\begin{align} S(y_p) &= S_0\Big(\frac{y_0-u}{b}\Big) = (1-p) \\ & \exp\Big[-\exp\Big(\frac{y_p-u}{b}\Big)\Big] = (1-p)\\ &\frac{y_p-u}{b} = \log\big[-\log(1-p)\big] = S_0^{-1}(1-p) = w_p\\[.2em] &\color{purple}{y_p = u + w_p\,b} \end{align}\]

CI for quantiles (Wald)

  • The estimate of \(p\)th quantile \[ \hat{y}_p = \hat{u} + w_p \hat{b} \]

  • Standard error of \(\hat y_p\) (using the multivariate delta method) \[ \operatorname{var}(\hat y_p) = \begin{bmatrix}1 & w_p\end{bmatrix} \hat V \begin{bmatrix} 1 \\ w_p\end{bmatrix} = \hat V_{11} + \hat V_{22}w_p^2 + 2\hat V_{12}w_p \]

  • Large sample based \(100(1-q)\%\) confidence interval for \(y_p\) \[ \hat y_p\pm z_{1-q/2} \;se(\hat y_p) \]

  • Find the \(100(1-q)\%\) confidence interval for \(t_p\)


CI for quantiles (LRT)

  • To obtain LRT statistic based confidence interval for the quantile \(y_p\), consider the following null hypothesis \[ H_0: y_p = y_{p_0} \]

  • The corresponding LRT statistic \[ \Lambda(y_{p_0}) = 2\ell(\hat u, \hat b) - 2\ell(\tilde u, \tilde b) %\tag{\ref{eq-lrt-quantile}} \]

    • The procedure of obtaining parameter estimates \(\tilde u\) and \(\tilde b\) (under \(H_0\)) is explained in Section 5.1.10.3)
  • LRT statistic based \((1-q)100\%\) confidence interval for \(y_p\) can be obtained from the set of \(y_{p_0}\) values such that \[ \Lambda(y_{p_0}) \leq \chi^2_{(1), 1- q} \]

CI for \(S(\cdot)\) (Wald)

  • To obtain confidence interval for survival probability \[ S(y_0) = S_0\Big(\frac{y_0-u}{b}\Big)=\exp\Big[-\exp\Big(\frac{y_0-u}{b}\Big)\Big] \]

  • We can defined \[ \psi = S_0^{-1}\Big(S(y_0)\Big)=\log\big[-\log\big(S(y_0)\big)\big]=\frac{y_0 - u}{b} \]

  • MLE and SE \[ \begin{aligned} \hat \psi &= \frac{y_0 - \hat u}{\hat b}\\ \operatorname{var}(\hat \psi) & = \boldsymbol{a}'\hat V\boldsymbol{a} = \begin{bmatrix}-1/\hat b & - \hat\psi/b\end{bmatrix} \begin{bmatrix} \hat V_{11} & \hat V_{12} \\ \hat V_{21} & \hat V_{22}\end{bmatrix} \begin{bmatrix} -1/\hat b \\ -\hat\psi/b\end{bmatrix} \end{aligned} \]


  • \((1-p)100\%\) CI for \(\psi\) \[ \begin{aligned} \hat\psi - se(\hat\psi)\,z_{1-p2} &< \psi \leq \hat\psi + se(\hat\psi)\,z_{1-p/2} \\ L & < \psi \leq U \end{aligned} \]

  • Confidence interval for \(S(y_0)\) \[ \begin{aligned} L &< \log\big[-\log\big(S(y_0)\big)\big] \leq U \\ \exp\big[-\exp(U)\big] &<S(y_0) \leq \exp\big[-\exp(L)\big] \end{aligned} \]

CI for \(S(\cdot)\) (LRT)

  • Consider the null hypothesis \(H_0: S(y_0)=s_0\), where \[ S(y_0) = \exp\Big[-\exp\Big(\frac{y_0-u}{b}\Big)\Big] \]

  • The \((1-p)100\%\) confidence interval for \(S(y_0)\) can be defined as the set of \(s_0\) values such that \(\Lambda(s_0) \leq \chi^2_{(1), 1-p}\), where \[ \Lambda(s_0) = 2\ell(\hat u, \hat b) - 2\ell(\tilde u, \tilde b) %\tag{\ref{lrt-s0}} \]

    • where \((\tilde u,\tilde b)\) are the MLEs under \(H_0\)

Example 5.2.1:

  • Leukemia remission time data were given in Example 1.1.7 and used as an example for the non-parametric methods (e.g. Kaplan-Meier method) described in Chapter 3

  • Two groups of patients (6MP and placebo), each group has 21 patients, were followed up to observed either remission or censoring times (in weeks)


Remission time data

glimpse(gehan65)
Rows: 42
Columns: 3
$ time   <dbl> 6, 6, 6, 6, 7, 9, 10, 10, 11, 13, 16, 17, 19, 20, 22, 23, 25, 3…
$ status <dbl> 1, 1, 1, 0, 1, 0, 1, 0, 0, 1, 1, 0, 0, 0, 1, 1, 0, 0, 0, 0, 0, …
$ drug   <chr> "6-MP", "6-MP", "6-MP", "6-MP", "6-MP", "6-MP", "6-MP", "6-MP",…
drug status n
6-MP 0 12
6-MP 1 9
placebo 1 21
  • Each group has 21 subjects, and all subjects of the placebo group were failed (end of remission) and drug group (6MP) has 12 censored times

  • Two separate Weibull distributions are assumed for the failure times of two treatment groups, e.g. 
    • 6MP group: \[T\sim \text{Weibull}(\alpha_1, \beta_1),\; Y=\log T\sim EV(u_1, b_1)\]
    • Placebo group: \[T\sim \text{Weibull}(\alpha_2, \beta_2),\; Y=\log T\sim EV(u_2, b_2)\]
  • Objectives: Drawing inference about the parameters

  • Observed data \[ \big\{(t_i, \delta_i), i=1, \ldots, n\big\} \]

  • Log-likelihood function \[ \ell(\alpha, \beta) = \sum_{i=1}^n\Big[\delta_i\log f(t_i; \alpha, \beta) + (1-\delta_i)\log S(t_i; \alpha, \beta)\Big] \]

  • MLEs \[(\hat\alpha, \hat\beta)' = {\arg\,\max}_{(\alpha, \beta)'\in \Theta}\,\ell(\alpha, \beta)\]


Analysis of remission time data (Extreme-value distribution)

  • Define \(y = \log t\) and corresponding probability density and survivor function \[\begin{align} f(y; u, b) &= \frac{1}{b}\,\exp\Big[(y-u)/b - e^{(y-u)/b}\Big] \\ S(y; u, b) &= \exp\Big[ - e^{(y-u)/b}\Big] \end{align}\]

  • Log-likelihood function \[\begin{align} \ell_{ev}(u, b) = \log \prod_{i=1}^n\Big[f(y_i; u, b)\Big]^{\delta_i}\big[S(y_i; u, b)\Big]^{1-\delta_i} \end{align}\]

  • MLEs \[(\hat u, \hat b)' = {\arg\,\max}_{(u, b)'\in \Theta}\,\ell_{ev}(u, b)\]

survreg function

  • R function survreg() can also be used to fit distributions of log-location-scale family, its syntax is similar to the syntax of survfit()
survreg(formula, data, dist)
  • In formula, response is a Surv object, e.g. to model the variables time and status \[\texttt{formula = Surv(time, status)}\sim \texttt{1}\]

  • Lifetime or log-lifetime distributions can be passed to survreg by the argument dist


  • Available lifetime or log-lifetime distributions include “weibull”, “exponential”, “gaussian”, “logistic”, “lognormal”, “loglogistic”, “extreme”

  • The time argument of Surv function is either a lifetime or a log-lifetime depending on whether the mentioned dist is a lifetime (e.g. “weibull”) or a log-lifetime (e.g. “extreme”) \[\begin{align*} \text{weibull}\rightarrow\;\; & \texttt{formula = Surv(time, status)}\sim \texttt{1}\\ \text{extreme}\rightarrow\;\; & \texttt{formula = Surv(log(time), status)}\sim \texttt{1} \end{align*}\]


Data for the treatment (6MP) group

d6mp <- gehan65 |> 
   filter(drug == "6-MP")
glimpse(d6mp)
Rows: 21
Columns: 3
$ time   <dbl> 6, 6, 6, 6, 7, 9, 10, 10, 11, 13, 16, 17, 19, 20, 22, 23, 25, 3…
$ status <dbl> 1, 1, 1, 0, 1, 0, 1, 0, 0, 1, 1, 0, 0, 0, 1, 1, 0, 0, 0, 0, 0
$ drug   <chr> "6-MP", "6-MP", "6-MP", "6-MP", "6-MP", "6-MP", "6-MP", "6-MP",…

Analysis of the treatment group using survreg function

w_sreg_6mp <- survreg(Surv(time, status) ~ 1, 
                  data = d6mp, dist = "weibull")
ev_sreg_6mp <- survreg(Surv(log(time), status) ~ 1, 
                  data = d6mp, dist = "extreme")

Extreme-value distribution

  • Estimates of model parameters \(u\) and \(\log b\)
broom::tidy(ev_sreg_6mp)
# A tibble: 2 × 5
  term        estimate std.error statistic  p.value
  <chr>          <dbl>     <dbl>     <dbl>    <dbl>
1 (Intercept)    3.52      0.273     12.9  6.28e-38
2 Log(scale)    -0.303     0.278     -1.09 2.77e- 1

  • Variance-covariance matrix of \((\hat u, \log \hat b)\)
vcov(ev_sreg_6mp)
            (Intercept) Log(scale)
(Intercept)  0.07473057 0.03305811
Log(scale)   0.03305811 0.07750538

Analysis of remission time data using survreg function

  • The survreg() function returns estimates of \((u, \log b)'\) and corresponding variance matrix

  • For making inference about Weibull distribution, followings are required

    1. estimate of \((u, b)'\) and the corresponding variance matrix

    2. estimate of \((\alpha, \beta)'\) and the corresponding variance matrix

  • It is important to understand the methods to obtain estimates and the corresponding variance of \((u, b)'\) and \((\alpha, \beta)'\) from the estimates and the corresponding variance of \((u, \log b)'\)


Homework

  • Obtain the variance-covarince matrix of \((\hat\alpha, \hat \beta)'\) and \((\hat u, \hat b)'\)

CIs of \((\alpha, \beta)\) (6MP group)

  • 95% CI using the sampling distribution of \((\hat\alpha, \hat\beta)\) \[\begin{align*} \hat \alpha \pm z_{.975} \,se(\hat\alpha) &= 33.765 \pm (1.96) (9.23) \\ &= 15.674 \;\text{to}\; 51.856\\[.25em] \hat \beta \pm z_{.975} \,se(\hat\beta) &= 1.354 \pm (1.96) (0.377) \\ &= 0.615 \;\text{to}\; 2.092 \end{align*}\]

  • 95% CI using the sampling distribution of \((\hat u, \log \hat b)\) \[\begin{align*} \hat u \pm z_{.975} \,se(\hat u) &= 2.984 \;\text{to}\; 4.055\\ \hat \alpha \pm z_{.975} \,se(\hat\alpha) &= \exp(2.984) \;\text{to}\; \exp(4.055) \\ &= 19.76 \;\text{to}\; 57.698 \end{align*}\]

    • Similarly \[\begin{align*} \log \hat b \pm z_{.975} \,se(\log \hat b) &= -0.849 \;\text{to}\; 0.243\\ \hat \beta \pm z_{.975} \,se(\hat\beta) &= 1/\exp(0.243) \;\text{to}\; 1/\exp(-0.849) \\ &= 0.784 \;\text{to}\; 2.336 \end{align*}\]

(Obtain the variance matrix of \((\hat u, \hat b)\) using the sampling distribution of \((\hat u, \log\hat b)'\))

  • 95% CI using the sampling distribution of \((\hat u, \hat b)\)

\[\begin{align*} \hat u \pm z_{.975} \,se(\hat u) &= 2.984 \;\text{to}\; 4.055\\ \hat \alpha \pm z_{.975} \,se(\hat\alpha) &= \exp(2.984) \;\text{to}\; \exp(4.055) \\ &= 19.76 \;\text{to}\; 57.698 \end{align*}\]

  • Similarly \[\begin{align*} \hat b \pm z_{.975} \,se(\hat b) &= 0.336 \;\text{to}\; 1.142\\ \hat \beta \pm z_{.975} \,se(\hat\beta) &= 1/1.142 \;\text{to}\; 1/0.336 \\ &= 0.876 \;\text{to}\; 2.979 \end{align*}\]

  • Using the method described in Section 5.2.5, we obtain the LRT-based CIs for \(u\) and \(b\)

Plot of LRT statistic against different null values \(u_0\) and 95% confidence interval for \(u\) and \(\alpha\)

Plot of LRT statistic against different null values \(b_0\) and 95% confidence interval for \(\log b\) and \(\beta\)

95% confidence intervals for \(\alpha\) and \(\beta\) by different methods
parameter method 6-MP
\(\alpha\) Wald \((\hat \alpha)\) (15.674, 51.856)
NA Wald \((\hat u)\) (19.76, 57.698)
NA LRT (21.933, 76.708)
\(\beta\) Wald \((\hat \beta)\) (0.615, 2.092)
NA Wald \((\log \hat b)\) (0.784, 2.336)
NA Wald \((\hat b)\) (0.876, 2.979)
NA LRT (0.726, 2.203)

Analyses for Placebo group

dplacebo <- gehan65 %>% 
  filter(drug == "placebo")

Model fit with the data of placebo group

w_sreg_p <- survreg(Surv(time, status) ~ 1, 
                  data = dplacebo, dist = "weibull")

Estimates of model parameters

broom::tidy(w_sreg_p)
# A tibble: 2 × 5
  term        estimate std.error statistic  p.value
  <chr>          <dbl>     <dbl>     <dbl>    <dbl>
1 (Intercept)    2.25      0.168     13.4  5.72e-41
2 Log(scale)    -0.315     0.174     -1.82 6.94e- 2

95% confidence intervals for \(\alpha\) and \(\beta\) by different methods
parameter method 6-MP Placebo
\(\alpha\) Wald \((\hat \alpha)\) (15.674, 51.856) (6.363, 12.601)
NA Wald \((\hat u)\) (19.76, 57.698) (6.824, 13.175)
NA LRT (21.933, 76.708) (6.659, 13.25)
\(\beta\) Wald \((\hat \beta)\) (0.615, 2.092) (0.904, 1.837)
NA Wald \((\log \hat b)\) (0.784, 2.336) (0.975, 1.926)
NA Wald \((\hat b)\) (0.876, 2.979) (1.023, 2.077)
NA LRT (0.726, 2.203) (0.951, 1.868)

Quantiles and their CIs

  • Estimate of \(p\)th quantile \[ \hat y_p = \hat u + \hat b w_p \]

    • \(w_p = \log[-\log(1-p)]\)

    • \(\hat u= 3.519\) and \(\hat b = 0.739\) (for treatment group)

  • Wald-type CI (see Section 5.2.6.1 for detail)
    \[ \hat y_p \pm se(\hat y_p) z_{1-q/2} \]

  • Note the estimate of \(\hat y_p\) depends on the estimate of \(\hat u\) and \(\hat b\), and the corresponding variance matrix

    • survreg() returns estimate and variance matrix for \(\hat u\) and \(\log \hat b\)

95% confidence intervals for different quantiles of treatment group (6-MP)
\(p\) \(w_p\) \(\hat y_p\) \(se(\hat y_p)\) lower upper
0.25 -1.246 2.599 0.655 3.726 48.559
0.50 -0.367 3.249 0.264 15.357 43.225
0.75 0.327 3.761 0.395 19.822 93.241

Plot of LRT statistic against different null values \(y_{p_0}\) and 95% confidence interval for \(y_{.25}\) and \(t_{.25}\) (6-MP group)

Plot of LRT statistic against different null values \(y_{p_0}\) and 95% confidence interval for \(y_{.5}\) and \(t_{.5}\) (6-MP group)

95% confidence intervals of different quantiles using Wald and LRT method (6-MP group)
\(p\) lower upper lower upper
0.25 3.726 48.559 6.586 23.058
0.50 15.357 43.225 16.289 51.342
0.75 19.822 93.241 27.522 112.730

95% confidence intervals for different quantiles using Wald and LRT method (placebo group)
\(p\) lower upper lower upper
0.25 1.362 10.707 2.031 5.927
0.50 4.499 11.708 5.755 9.488
0.75 8.592 16.863 8.873 16.996

Survivor function

  • For Weibull distribution, the expression of survivor function \[ S(t; \alpha, \beta) = \exp\big(-(t/\alpha)^{\beta}) \]

  • Estimated survivor function \[ S(t; \hat\alpha, \hat\beta) = \exp\big(-(t/\hat\alpha)^{\hat\beta}) \]

par 6-MP placebo
\(\alpha\) 33.765 9.482
\(\beta\) 1.354 1.370

Comparison survival probabilities of between two treatment groups

Figure 5.1: Comparison of parametric (Weibull) and non-parametric (step-function) estimates of survivor function using remission time data

Homework

  • Obtain Wald and LRT statistics based confidence interval for the survival probability \(S(10)\)